一、Oracle 表空间监控
1、创建脚本check_tablespace.sh
Oracle表空间的信息需要SQL语句查询得到,因此,我们首先创建一个获取表空间信息的原始脚本/h ome/oracle/check_tablespace.sh,这个脚本由oracle用户去执行,脚本内容如下:
#!/bin/bash
# tablespace usagep check
source ~/.bash_profile
function check {
sqlplus -S "/ as sysdba" <<  EOF
set linesize 200
set pagesize 200
spool /tmp/ora_tablespace.txt
SELECT UPPER(F.TABLESPACE_NAME) "tablespacename",
D.TOT_GROOTTE_MB "ALL(G)",
D.TOT_GROOTTE_MB - F.TOTAL_BYTES "USER(G)",
TO_CHAR(ROUND(((D.TOT_GROOTTE_MB - F.TOTAL_BYTES)*100) / DDF.MAX_BYTES ,2),'990.99') || '%' "P",
DDF.MAX_BYTES "MAX(G)"
FROM (SELECT TABLESPACE_NAME,
ROUND(SUM(BYTES) / (1024 * 1024 * 1024), 2) TOTAL_BYTES
FROM SYS.DBA_FREE_SPACE
GROUP BY TABLESPACE_NAME) F,
(SELECT DD.TABLESPACE_NAME,
ROUND(SUM(DD.BYTES) / (1024 * 1024 * 1024), 2) TOT_GROOTTE_MB
FROM SYS.DBA_DATA_FILES DD
GROUP BY DD.TABLESPACE_NAME) D,
(select tablespace_name,sum(case when maxbytes!='0' then maxbytes/1024/1024/1024 else bytes/1024/1024/1024 end) max_bytes
from dba_data_files group by tablespace_name) ddf
where D.tablespace_name=F.tablespace_name and d.tablespace_name=ddf.tablespace_name
ORDER BY 1;
spool off
set linesize 100
set pagesize 100
spool /tmp/ora_check.txt
select tablespace_name,autoextensible from dba_data_files;
spool off
quit
EOF
};check &>/dev/null
执行这个脚本,并生成两个保存有oracle表空间名称信息的文件:/tmp/ora_tablespace.txt和/tmp/ora_autex.txt。
yxtuser@mydb:tmp$ cat ora_tablespace.txt

tablespacename                     ALL(G)    USER(G) P            MAX(G)
------------------------------ ---------- ---------- -------- ----------
IM_DATA                            334.36     324.71   77.68% 417.999878
IND_SMS_AR_NEW                     358.29     226.02   61.18%  369.42186
SYSAUX                              11.62       1.24    2.97% 41.7656097
SYSTEM                              40.91        .58    1.24% 46.6484222
TBS_ARRIVE_MAX                        .03          0    0.00% 31.9999847
TBS_ARRIVE_MAX_NEW                 540.26     514.12   92.14% 557.999863
TBS_DCAP                            86.56      66.56   57.61% 115.531204
TBS_DCAP_INDX                         .39        .13    0.41% 31.9999847
TBS_PARTITION_01                   242.17     216.68   68.62% 315.765579

=====================================================================================
yxtuser@mydb:tmp$ cat ora_check.txt

TABLESPACE_NAME                AUT
------------------------------ ---
IND_SMS_AR_NEW                 NO
TBS_ARRIVE_MAX_NEW             NO
IM_DATA                        NO
USERS                          YES
SYSAUX                         YES
IM_DATA                        YES
SYSTEM                         YES
TBS_STAT_USER_DATA             NO
TBS_DCAP                       YES
TBS_STAT_USER_DATA             NO
IM_DATA                        NO
IM_DATA                        NO
TBS_STAT_USER_DATA             NO
TBS_USER_ACCT_DATA             NO
TBS_PARTITION_06               NO
TBS_USER_ACCT_INDX             NO
TBS_PARTITION_01               YES
我们需要把脚本放到oracle用户的crontab计划任务表中,让脚本在后台每5分钟执行一次,一定要保 证计划任务能正常按计划执行,否则这可能会被监控欺骗(监控端获取到的数据一直保持不变)。
oracle@mydb:~$ crontab -l
0 */2 * * * sh /data/tablespace_check.sh
2、创建脚本discovery_oracle_tablespace.sh
通过脚本取得表空间的名字,并转换成json格式的(因为zabbix的自动发现功能获取的数据类型是J SON格式的)。 下面编写一个zabbix自动发现oracle表空间的脚本,我这里的脚本路径是/etc/zabbix/scripts/discov ery_oracle_tablespace.sh。
#!/bin/bash
#zabbix discovery oracle tablespace
table_spaces=(`cat /tmp/ora_tablespace.txt | sed -e "1,3d" -e "/^$/d" -e "/selected/d" | awk '{print $1 }'`)
length=${#table_spaces[@]}
printf "{\n"
printf  '\t'"\"data\":["
for ((i=0;i<$length;i++));do
	printf '\t\t{\n'
	printf "\t\t\"{#ORACE_TABLES}\":\"${table_spaces[$i]}\"\n"
	 printf '\t\t}\n'
	if [ $i -lt $[ $length - 1 ] ];then
		printf '\t\t,\n'
	fi
done
printf  "\n\t]\n"
printf "}\n"
3、创建监控项目检测脚本tablespace_check.sh
用于zabbix获取oracle表空间使用率、剩余量和检查是否开启自动扩展。脚本为/etc/zabbix/scripts/tablespace_che ck.sh,脚本内容如下:
#!/bin/bash
# oracle tablespace check
CEHCK_TYPE=$1
TABLESPACE_NAME=$2

function usagepre {

    grep "\b$TABLESPACE_NAME\b" /tmp/ora_tablespace.txt | awk '{printf "%.f\n",$3/$5*100}'
}

function available {

    grep "\b$TABLESPACE_NAME\b" /tmp/ora_tablespace.txt | awk '{printf "%.f\n",$5-$3}'

}

function check {
    if grep "\b$TABLESPACE_NAME\b" /tmp/ora_autex.txt | awk '{print $2} ' | uniq | grep "YES" &>/dev/null;then
        echo 1
    else
        echo 0
    fi
}

case $CEHCK_TYPE in
    pre)
        usagepre ;;
    free)
        available ;;
    check)
        check ;;
    *)
        echo -e "Usage: $0 [pre|fre|check] [TABLESPACE_NAME]"
esac
给创建的脚本添加执行权限。
cd /etc/zabbix/scripts
chmod +x tablespace_check.sh
chmod +x discovery_oracle_tablespace.sh
4、为Zabbix增加监控Key
在Zabbix客户端配置文件/etc/zabbix/zabbix_agentd.conf增加如下参数:
Include=/etc/zabbix/zabbix_agentd.conf.d/*.conf
创建文件/etc/zabbix/zabbix_agentd.conf.d/oracle_tablespace.conf,内容如下:
UserParameter=discovery.oracle.tablespace,/etc/zabbix/scripts/discovery_oracle_tablespace.sh
UserParameter=tablespace.check[*],/etc/zabbix/scripts/tablespace_check.sh $1 $2
重新启动Zabbix客户端服务
service zabbix_agentd restart
5、在Zabbix服务端测试监控Key
测试结果如下,一切正常。
[root@mydb bin]# ./zabbix_get -s 192.168.1.100 -k tablespace.check[pre,SYSTEM]
100
二、Zabbix服务端配置
1、导入监控模板zbx_export_templates.xml内容如下:
<?xml version="1.0" encoding="UTF-8"?>
<zabbix_export>
<version>3.4</version>
<date>2018-07-16T02:54:53Z</date>
<groups>
<group>
<name>Templates</name>
</group>
</groups>
<templates>
<template>
<template>Discovery_Oracle_Table_Monitor</template>
<name>Oracle 监控</name>
<description/>
<groups>
<group>
<name>Templates</name>
</group>
</groups>
<applications>
<application>
<name>oracle监控</name>
</application>
</applications>
<items/>
<discovery_rules>
<discovery_rule>
<name>Oracle tablespace discover</name>
<type>0</type>
<snmp_community/>
<snmp_oid/>
<key>discovery.oracle.tablespace</key>
<delay>30s</delay>
<status>0</status>
<allowed_hosts/>
<snmpv3_contextname/>
<snmpv3_securityname/>
<snmpv3_securitylevel>0</snmpv3_securitylevel>
<snmpv3_authprotocol>0</snmpv3_authprotocol>
<snmpv3_authpassphrase/>
<snmpv3_privprotocol>0</snmpv3_privprotocol>
<snmpv3_privpassphrase/>
<params/>
<ipmi_sensor/>
<authtype>0</authtype>
<username/>
<password/>
<publickey/>
<privatekey/>
<port/>
<filter>
<evaltype>0</evaltype>
<formula/>
<conditions/>
</filter>
<lifetime>30d</lifetime>
<description/>
<item_prototypes>
<item_prototype>
<name>Oracle tablespace:,{#ORACE_TABLES} 是否自动扩展</name>
<type>0</type>
<snmp_community/>
<snmp_oid/>
<key>tablespace.check[check,{#ORACE_TABLES}]</key>
<delay>1h</delay>
<history>90d</history>
<trends>365d</trends>
<status>1</status>
<value_type>3</value_type>
<allowed_hosts/>
<units/>
<snmpv3_contextname/>
<snmpv3_securityname/>
<snmpv3_securitylevel>0</snmpv3_securitylevel>
<snmpv3_authprotocol>0</snmpv3_authprotocol>
<snmpv3_authpassphrase/>
<snmpv3_privprotocol>0</snmpv3_privprotocol>
<snmpv3_privpassphrase/>
<params/>
<ipmi_sensor/>
<authtype>0</authtype>
<username/>
<password/>
<publickey/>
<privatekey/>
<port/>
<description/>
<inventory_link>0</inventory_link>
<applications>
<application>
<name>oracle监控</name>
</application>
</applications>
<valuemap/>
<logtimefmt/>
<preprocessing/>
<jmx_endpoint/>
<application_prototypes/>
<master_item_prototype/>
</item_prototype>
<item_prototype>
<name>Oracle tablespace:{#ORACE_TABLES} 可用大小</name>
<type>0</type>
<snmp_community/>
<snmp_oid/>
<key>tablespace.check[free,{#ORACE_TABLES}]</key>
<delay>1h</delay>
<history>90d</history>
<trends>365d</trends>
<status>1</status>
<value_type>3</value_type>
<allowed_hosts/>
<units/>
<snmpv3_contextname/>
<snmpv3_securityname/>
<snmpv3_securitylevel>0</snmpv3_securitylevel>
<snmpv3_authprotocol>0</snmpv3_authprotocol>
<snmpv3_authpassphrase/>
<snmpv3_privprotocol>0</snmpv3_privprotocol>
<snmpv3_privpassphrase/>
<params/>
<ipmi_sensor/>
<authtype>0</authtype>
<username/>
<password/>
<publickey/>
<privatekey/>
<port/>
<description/>
<inventory_link>0</inventory_link>
<applications>
<application>
<name>oracle监控</name>
</application>
</applications>
<valuemap/>
<logtimefmt/>
<preprocessing/>
<jmx_endpoint/>
<application_prototypes/>
<master_item_prototype/>
</item_prototype>
<item_prototype>
<name>Oracle tablespace:{#ORACE_TABLES} 使用率</name>
<type>0</type>
<snmp_community/>
<snmp_oid/>
<key>tablespace.check[pre,{#ORACE_TABLES}]</key>
<delay>5m</delay>
<history>90d</history>
<trends>365d</trends>
<status>0</status>
<value_type>0</value_type>
<allowed_hosts/>
<units>%</units>
<snmpv3_contextname/>
<snmpv3_securityname/>
<snmpv3_securitylevel>0</snmpv3_securitylevel>
<snmpv3_authprotocol>0</snmpv3_authprotocol>
<snmpv3_authpassphrase/>
<snmpv3_privprotocol>0</snmpv3_privprotocol>
<snmpv3_privpassphrase/>
<params/>
<ipmi_sensor/>
<authtype>0</authtype>
<username/>
<password/>
<publickey/>
<privatekey/>
<port/>
<description/>
<inventory_link>0</inventory_link>
<applications>
<application>
<name>oracle监控</name>
</application>
</applications>
<valuemap/>
<logtimefmt/>
<preprocessing/>
<jmx_endpoint/>
<application_prototypes/>
<master_item_prototype/>
</item_prototype>
</item_prototypes>
<trigger_prototypes>
<trigger_prototype>
<expression>{Discovery_Oracle_Table_Monitor:tablespace.check[pre,{#ORACE_TABLES}].last()}>95</expression>
<recovery_mode>0</recovery_mode>
<recovery_expression/>
<name>{HOST.NAME}数据库表空间:{#ORACE_TABLES}剩余空间低于5%</name>
<correlation_mode>0</correlation_mode>
<correlation_tag/>
<url/>
<status>0</status>
<priority>2</priority>
<description/>
<type>0</type>
<manual_close>0</manual_close>
<dependencies/>
<tags/>
</trigger_prototype>
</trigger_prototypes>
<graph_prototypes/>
<host_prototypes/>
<jmx_endpoint/>
</discovery_rule>
</discovery_rules>
<httptests/>
<macros/>
<templates/>
<screens/>
</template>
</templates>
</zabbix_export>
2、套用新建好的模板应该到需要监控主机

三、结果验证
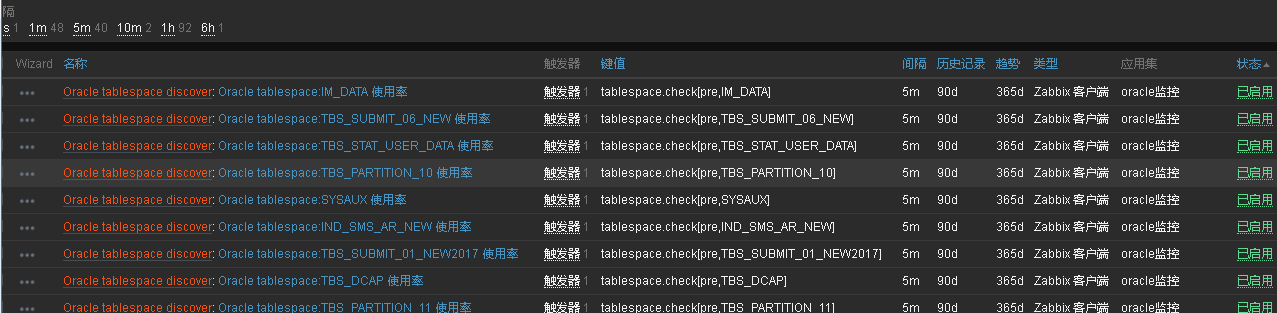
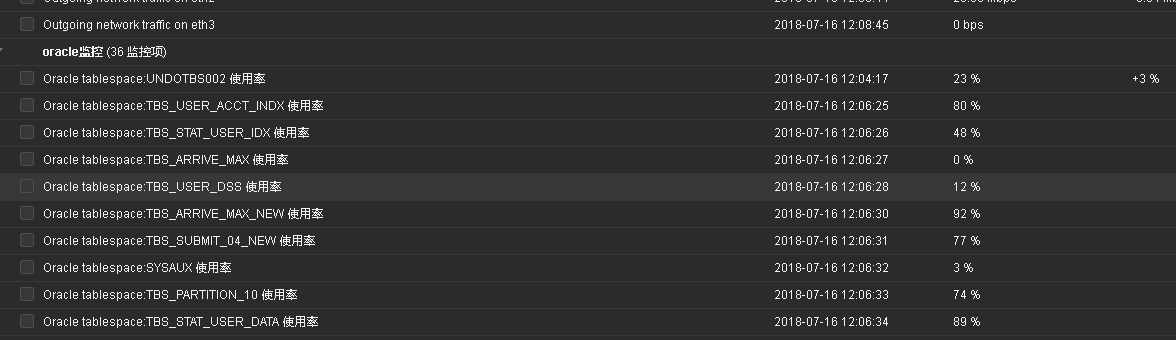
1、等待一段时间的发现之后,我们可以看到主机发现了相关的监
控项,并可以执行报警信息。
END